
Just in time for the holidays, here are key financial facts you want to take in: If nothing unexpected happens, current earnings estimates through 2025 imply a bullish path for stocks. Here’s what moved the stock market higher for the past seven weeks and why the outlook for investors is bright. 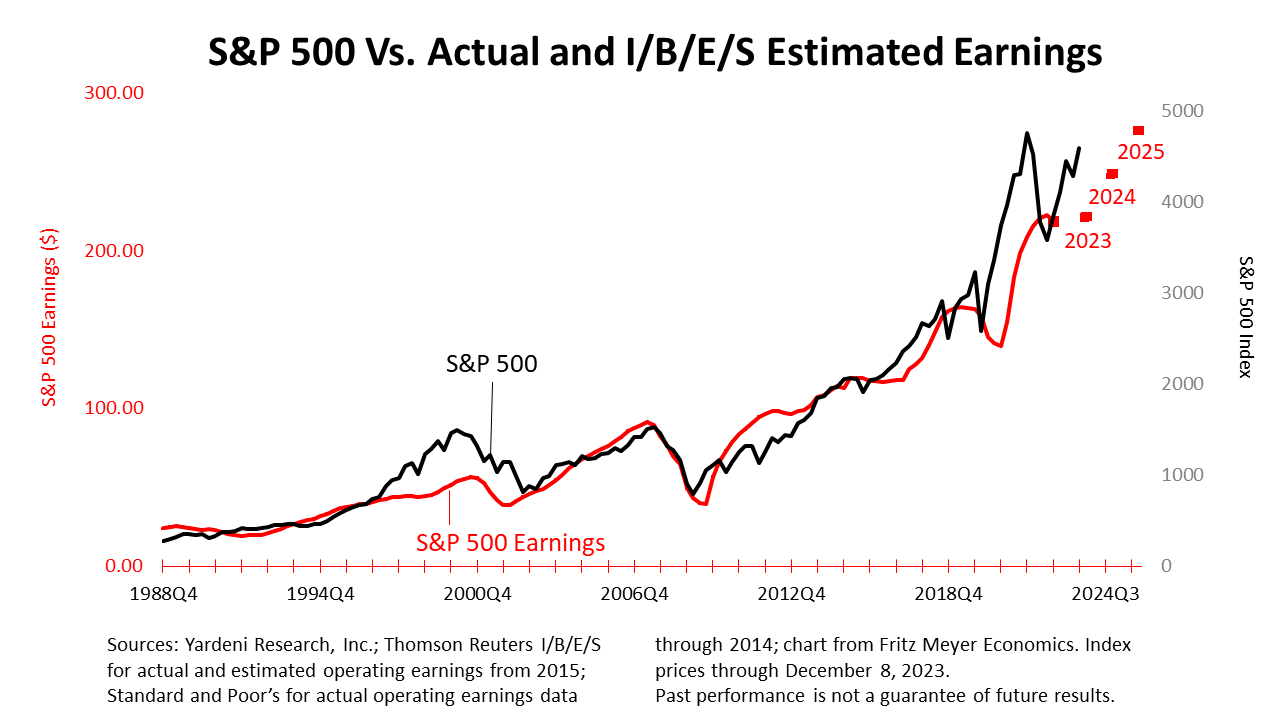
In this chart assembled by independent economist Fritz Meyer, the black line represents the S&P 500 price index, and the red line represents actual earnings of the average company in the Standard & Poor’s 500 stock index. The red squares represent the earnings estimates by Wall Street analysts, based on data from Institutional Brokers’ Estimate System (I/B/E/S), a database used by brokers and active investors to access the estimates made by stock analysts of future earnings of publicly traded American companies. Earnings drive stocks, which is why the black line tracks closely with the red line. Wall Steet estimates earnings of the average share in a S&P 500 company in 2023 will come in at $220.79. Earnings in 2024 are expected to come in at $245.75, and at $275.28 in 2025., as indicated by the red squares. Barring some unexpected major bad news — or good news — and assuming earnings come in as predicted by Wall Street’s analysts, the black line can reasonably be expected to be pulled higher toward the red squares in the months ahead. 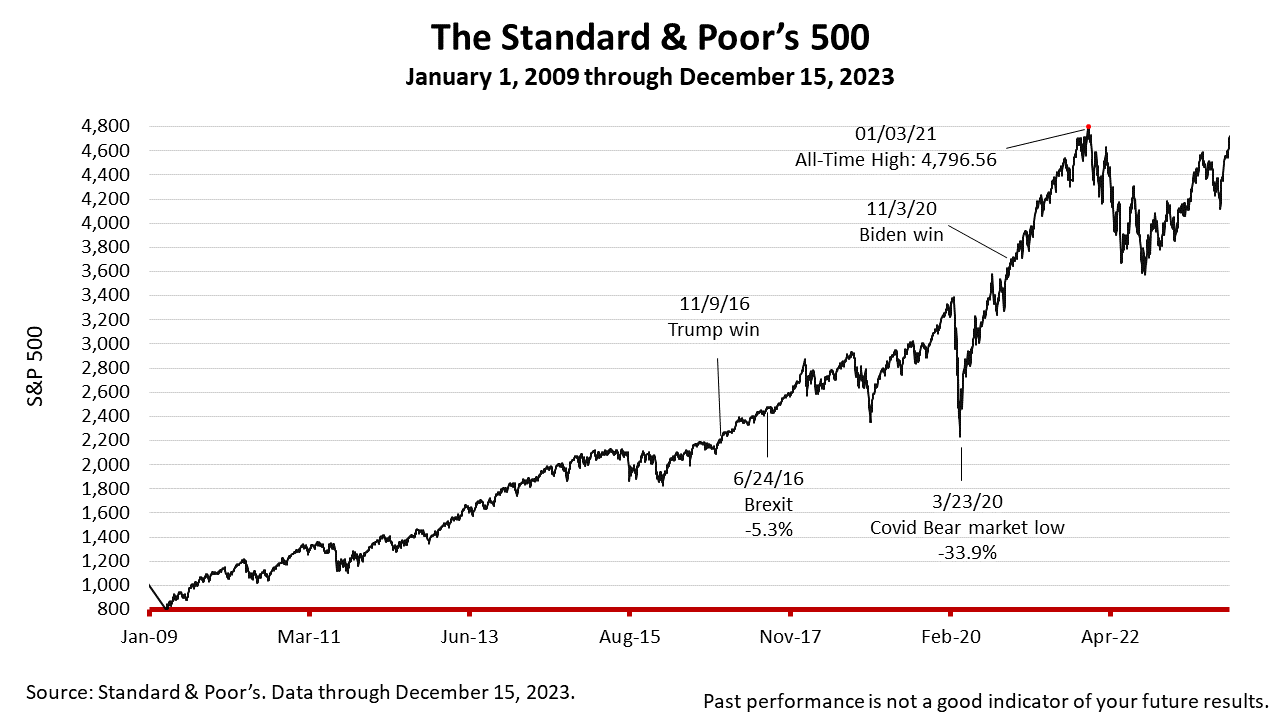
The Standard & Poor’s 500 stock index closed higher for the seventh straight week on Friday, Dec. 15, 2023, and is not far from its all-time high reached almost exactly two years ago. The S&P 500 stock index closed Friday at 4719.19, down -0.01% from Thursday, and up +2.5% from a week ago. The big gain was attributed to the Federal Reserve’s monetary policy pronouncements at the conclusion of a two-day meeting of the Federal Open Market Committee on Wednesday. Unexpectedly dovish comments about the inflation outlook by Fed chairman Jerome Powell at a press conference Wednesday made investors believe that the Fed was pulling off a “soft landing.” To be clear, the Fed hiked the rate at which it loans money to banks 11 times between March 2022 and July 2023 — from about 0.25% to 5.25% — and it has succeeded in lowering inflation without causing a recession, and growth remains the likely path. The S&P 500 index is up +110.92% from the March 23, 2020 bear market low and just -1.61% lower than its all-time high, reached January 3, 2021. The Standard & Poor's 500 (S&P 500) is an unmanaged group of securities considered to be representative of the stock market in general. It is a market-value weighted index with each stock's weight proportionate to its market value. Index returns do not include fees or expenses. Investing involves risk, including the loss of principal, and past performance is no guarantee of future results. The investment return and principal value of an investment will fluctuate so that an investor's shares, when redeemed, may be worth more or less than their original cost. Current performance may be lower or higher than the performance quoted. Nothing contained herein is to be considered a solicitation, research material, an investment recommendation, or advice of any kind, and it is subject to change without notice. Any investments or strategies referenced herein do not take into account the investment objectives, financial situation or particular needs of any specific person. Product suitability must be independently determined for each individual investor. Tax advice always depends on your particular personal situation and preferences. You should consult the appropriate financial professional regarding your specific circumstances.
The material represents an assessment of financial, economic and tax law at a specific point in time and is not intended to be a forecast of future events or a guarantee of future results. Forward-looking statements are subject to certain risks and uncertainties. Actual results, performance, or achievements may differ materially from those expressed or implied. Information is based on data gathered from what we believe are reliable sources. It is not guaranteed as to accuracy, does not purport to be complete, and is not intended to be used as a primary basis for investment decisions.
This article was written by a professional financial journalist for Advisor Products and is not intended as legal or investment advice. |